Unlocking the Secrets of Building Efficiency: The Role of Utility and Environmental Data in Understanding Energy Use Intensity (EUI)

Understanding the nuances of building operations and sustainability is more crucial than ever. Among the myriad metrics available, Energy Use Intensity (EUI) stands out as a key indicator of a building’s energy performance. However, accurately gauging EUI—and, by extension, optimizing building efficiency—requires more than just a cursory glance at utility bills. It necessitates a deep dive into both utility data and external environmental conditions, such as temperature and humidity. Integrating these data streams can unveil temperature-correlated energy usage dashboards, a central tool for energy and sustainability managers aiming to reduce carbon footprints and operational costs.
The Vital Role of Utility Data
Utility data, encompassing electricity, water, gas, and other services, forms the backbone of any energy management strategy. By tracking how much of these resources a building consumes over time, managers can identify baseline energy use and pinpoint areas of inefficiency. However, utility data on its own offers a limited view. Without context, fluctuations in energy consumption could be misleading, attributed to operational changes when, in fact, they might be closely tied to external environmental conditions.
The Impact of Temperature and Humidity
Temperature and humidity significantly influence a building’s energy consumption, particularly in terms of heating, ventilation, and air conditioning (HVAC) systems. For example, a spike in energy use during a heatwave might suggest inefficiency. Still, when considering the extreme temperatures, this usage might actually reflect a well-functioning system keeping up with increased demand. Similarly, high humidity levels can force HVAC systems to work harder, removing excess moisture to maintain indoor comfort, thus elevating energy use. Without correlating utility data with these environmental factors, energy managers could misinterpret the efficiency of their buildings.
Crafting Temperature-Correlated Energy Usage Dashboards
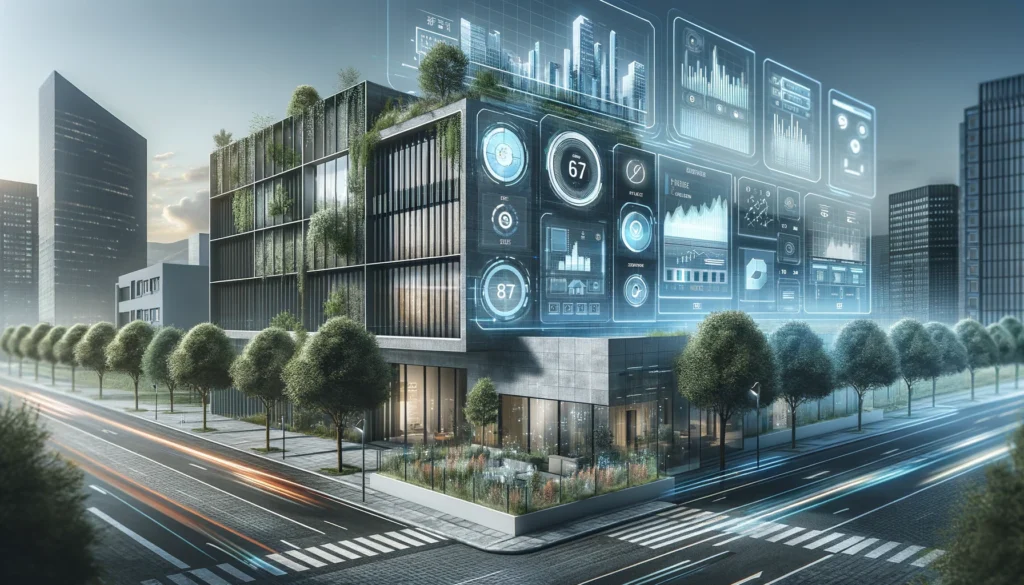
This is where temperature-correlated energy usage dashboards come into play. By integrating utility data with real-time environmental information, these dashboards offer a nuanced view of a building’s energy performance. They allow managers to see not just how much energy is being used, but how external conditions are influencing that use. This level of insight is crucial for accurately calculating and understanding a building’s EUI.
EUI: A Benchmark for Building Efficiency
EUI measures a building’s energy consumption relative to its size, providing a simple metric to compare buildings of different types and sizes. It’s calculated by dividing the total energy consumed by the building in one year (expressed in kBtu) by the building’s total gross floor area. While EUI offers a valuable benchmark for energy performance, its usefulness is significantly enhanced when analyzed alongside temperature and humidity data. This correlation helps isolate the impact of weather on energy use, providing a clearer picture of a building’s intrinsic efficiency.
Applications and Benefits
With temperature-correlated energy usage dashboards, energy managers can:
- Identify Anomalies: Quickly spot when a building’s energy use deviates from expected patterns given current weather conditions.
- Validate Efficiency Measures: Assess the real impact of energy-saving initiatives, accounting for the influence of external temperature and humidity.
- Optimize Operations: Adjust settings and schedules for HVAC and other systems in anticipation of weather changes, rather than reacting to them, enhancing both energy efficiency and occupant comfort.
- Improve Budgeting and Forecasting: More accurately predict future energy use and costs by understanding the relationship between weather patterns and energy consumption.
Implementing a Data-Driven Approach
To create and utilize temperature-correlated energy usage dashboards effectively, energy and sustainability managers should:
- Integrate Data Sources: Ensure utility and environmental data streams are integrated into a centralized platform. This may require the implementation of IoT sensors and smart meters.
- Leverage Analytics Tools: Use advanced analytics and machine learning algorithms to correlate data and reveal insights. These tools can automatically adjust for variables such as daylight savings and building occupancy patterns.
- Adopt Continuous Monitoring: Rather than relying on monthly reports, adopt a system of continuous monitoring for real-time decision-making.
- Engage Stakeholders: Share insights and findings with building occupants, management, and other stakeholders. Educating them about how their actions affect energy use can drive collective efforts toward efficiency.
Understanding a building’s EUI is central to advancing its energy efficiency and sustainability goals. However, achieving a true understanding requires more than just analyzing utility data in isolation. By incorporating external temperature and humidity data into temperature-correlated energy usage dashboards, energy and sustainability managers unlock a powerful tool in their quest to optimize building operations. This integrated approach not only illuminates the path to reducing energy consumption and costs but also enhances the comfort and well-being of those who inhabit these spaces. In the end, the quest for efficiency and sustainability is not just about data; it’s about creating better environments for everyone.

Recent Comments